

如何使用 React 构建营销仪表盘(Twitter 和 YouTube)
集成在跨服务通信中发挥着至关重要的作用。在本指南中,我们将构建一个集成了Twitter和YouTube 的营销分析仪表板。该仪表板可用于在单一视图中跟踪两个平台上的统计数据。
我们正计划打造类似这样的产品👇

我们将使用:
- 使用React构建前端。
- Blueprint作为我们的 UI 库
- Canonic 的后端模板
- 使用GraphQL获取数据。
- React-chartjs-2用于构建图表。
让我们开始吧!🚀
第一步:项目启动
要创建项目,我们将使用create-react-app。在终端中执行以下命令来创建基本样板设置。我们将项目命名为marketing-dashboard。
npx create-react-app marketing-dashboard
步骤 2:添加依赖项
让我们添加上面列出的所有 UI 和 GraphQL 依赖项。导航到项目文件夹,然后开始添加依赖项。
yarn add @blueprintjs/core @apollo/client graphql@15.7.1 react-chartjs-2 chart.js
现在我们来讨论一下项目架构。我们将有三个顶级组件架构:
- 标题
- 中间组件——进一步分为两个组件——Twitter 和 YouTube
- 页脚
步骤 3:构建顶层组件
我们先来修改一下App.js,以便容纳顶层组件。我们会直接在 `<head>` 标签内添加 `<head> Header` 和`<body>` 组件,并为 `<body>` 和 `<body> ` 组件创建空间。顺便也添加一些样式吧 :PFooterAppTwitterYoutube
// Import React and Blueprint dependencies
import React from "react";

import "@blueprintjs/core/lib/css/blueprint.css";
import { Navbar, Alignment, Divider } from "@blueprintjs/core";

import "./App.css";

const App = () => {
  return (
    <div className="App">
      {/* Header */}
      <Navbar className="bp3-dark" style={{ position: "fixed", top: "0" }}>
        <Navbar.Group align={Alignment.LEFT}>
          <Navbar.Heading style={{ marginLeft: "30px" }}>
            Marketing Dashboard
          </Navbar.Heading>
        </Navbar.Group>
      </Navbar>
      {/* Middle Container to hold our Metrics */}
      <div
        style={{ marginLeft: "30px", marginTop: "80px", marginRight: "30px" }}
      >
        <div style={{ marginTop: "50px" }}>
         {/* Youtube component will go here */}
        </div>
        <Divider style={{ marginTop: "50px" }}></Divider>
        <div style={{ marginTop: "50px" }}>
          {/* Twitter component will go here */}
        </div>
        <Divider style={{ marginTop: "50px" }}></Divider>
      </div>
      {/* Footer */}
      <div>
        <h5
          style={{
            fontSize: "medium",
            textAlign: " left",
            margin: "30px 30px 20px 30px",
          }}
        >
          Canonic ©2021 Created by Canonic Inc
        </h5>
      </div>
    </div>
  );
};

export default App;
移除文件中所有预加载的 CSS App.css。
步骤 4:模拟数据以进行显示
我们将创建模拟 API 响应的虚拟数据,并直接将其提供给我们的Twitter组件Youtube。
让我们创建dummyData.js一个src目录,并添加以下包含两个平台指标的虚拟数据。
export const dummyData = {
  metric: {
    youtubeMetrics: {
      rows: [[745, 2, 16, 1, 597, 48]],
      columnHeaders: [
        {
          columnType: "METRIC",
          dataType: "INTEGER",
          name: "views",
        },
        {
          columnType: "METRIC",
          dataType: "INTEGER",
          name: "comments",
        },
        {
          columnType: "METRIC",
          dataType: "INTEGER",
          name: "likes",
        },
        {
          columnType: "METRIC",
          dataType: "INTEGER",
          name: "dislikes",
        },
        {
          columnType: "METRIC",
          dataType: "INTEGER",
          name: "estimatedMinutesWatched",
        },
        {
          columnType: "METRIC",
          dataType: "INTEGER",
          name: "averageViewDuration",
        },
      ],
    },
    youtubeMinutesDay: {
      rows: [
        ["2020-10-17", 0],
        ["2020-10-18", 1],
        ["2020-10-19", 4],
        ["2020-10-20", 0],
        ["2020-10-21", 4],
        ["2020-10-22", 4],
        ["2020-10-23", 1],
        ["2020-10-24", 4],
        ["2020-10-25", 0],
        ["2020-10-26", 1],
        ["2020-10-27", 0],
        ["2020-10-28", 0],
        ["2020-10-29", 0],
        ["2020-10-30", 1],
        ["2020-10-31", 0],
        ["2020-11-01", 1],
        ["2020-11-02", 1],
        ["2020-11-03", 2],
        ["2020-11-04", 5],
        ["2020-11-05", 0],
        ["2020-11-06", 1],
        ["2020-11-07", 0],
        ["2020-11-08", 5],
        ["2020-11-09", 3],
      ],
      columnHeaders: [
        {
          columnType: "DIMENSION",
          dataType: "STRING",
          name: "day",
        },
        {
          columnType: "METRIC",
          dataType: "INTEGER",
          name: "estimatedMinutesWatched",
        },
      ],
    },
    youtubeMinutesCountry: {
      rows: [
        ["IN", 30],
        ["US", 12],
      ],
      columnHeaders: [
        {
          columnType: "DIMENSION",
          dataType: "STRING",
          name: "country",
        },
        {
          columnType: "METRIC",
          dataType: "INTEGER",
          name: "estimatedMinutesWatched",
        },
      ],
    },
    twitter: {
      data: {
        name: "Canonic",
        username: "CanonicHQ",
        profile_image_url:
          "https://pbs.twimg.com/profile_images/1316281577148571653/-12Ans7U_normal.jpg",
        location: "United States",
        description:
          "The lowcode backend to your frontend. Ranked #3 Product of the day on @producthunt #lowcode #nocode #reactjs #graphql #technology #automation #backend",
        public_metrics: {
          followers_count: 394,
          following_count: 641,
          tweet_count: 161,
          listed_count: 25,
        },
      },
    },
  },
};
当我们将这些数据输入到组件中时,需要对其进行规范化处理,以便高效地显示数据。为此,我们将创建一些实用函数,将这些数据转换为更易读的格式。
创建一个新目录,并utils在src/其中创建一个新文件src/utils/normaliseData.js。normaliseData.js我们将在其中添加用于转换和规范化 YouTube 数据、Twitter 数据以及图表数据的函数。
export const normaliseTwitterData = (twitter) => {
  if (Object.keys(twitter).length === 0) {
    return { accountInformation: {}, metrics: [] };
  }

  const twitterData = twitter.twitter;
  return {
    accountInformation: {
      title: "Account Information",
      username: `@${twitterData.username}`,
      description: twitterData.description,
      location: twitterData.location,
    },
    metrics: [
      {
        title: "Followers",
        description: twitterData.public_metrics.followers_count,
      },
      {
        title: "Following",
        description: twitterData.public_metrics.following_count,
      },
      {
        title: "Tweets",
        description: twitterData.public_metrics.tweet_count,
      },
      {
        title: "Listed",
        description: twitterData.public_metrics.listed_count,
      },
    ],
  };
};

export const normaliseYoutubeMetrics = (youtubeData) => {
  return (
    youtubeData.columnHeaders.map((column, index) => {
      return {
        title: camelCaseToSentenceCase(column.name),
        description: youtubeData.rows[0][index],
      };
    }) || []
  );
};

export const normaliseEstimatedMinutesWatched = (estimatedMinutes) => {
  const labels =
    estimatedMinutes.rows.map((row) => {
      return row[0];
    }) || [];

  const data = estimatedMinutes.rows.map((row) => {
    return `${row[1]}`;
  });

  return {
    labels,
    datasets: [
      {
        label: "Minutes Watched / Day",
        data,
        fill: true,
        backgroundColor: "rgba(53, 162, 235, 0.5)",
        borderColor: "rgb(53, 162, 235)",
      },
    ],
  };
};

export const normaliseEstimatedMinutesPerCountry = (
  estimatedMinutesCountry
) => {
  const labels =
    estimatedMinutesCountry.rows.map((row) => {
      return row[0];
    }) || [];

  const data = estimatedMinutesCountry.rows.map((row) => {
    return `${row[1]}`;
  });

  return {
    labels,
    datasets: [
      {
        label: "Minutes Watched / Country",
        data,
        fill: true,
        backgroundColor: "rgba(255, 99, 132, 0.5)",
      },
    ],
  };
};

const camelCaseToSentenceCase = (text) => {
  const result = text.replace(/([A-Z])/g, " $1");
  return result.charAt(0).toUpperCase() + result.slice(1);
};
步骤 5:创建 Twitter 和 YouTube 组件
让我们创建最后两个必需组件——Twitter 和 YouTube。我们将创建一个卡片式仪表盘。
创建一个components目录,并将相关文件Twitter.js分别添加Youtube.js到各自的文件夹中。接下来,让我们添加代码!
src/components/Twitter/Twitter.js
import React from "react";

import { Card, Elevation } from "@blueprintjs/core";
import { normaliseTwitterData } from "../../utils/normaliseData";

const Twitter = (twitter = {}) => {
  const twitterData = normaliseTwitterData(twitter);
  return (
    <div>
      <h5 style={{ fontSize: "large", textAlign: " left" }}>Twitter</h5>
      <div
        style={{
          display: "flex",
          flexWrap: "wrap",
          justifyContent: "space-between",
          gap: "10px",
        }}
      >
        <Card
          interactive={true}
          elevation={Elevation.TWO}
          style={{
            minWidth: "200px",
            minHeight: "200px",
            maxWidth: "500px",
          }}
        >
          <h5 style={{ fontSize: "large", color: "#394b59" }}>
            {twitterData.accountInformation.title}
          </h5>
          <div style={{ fontSize: "medium" }}>
            <p>{twitterData.accountInformation.username}</p>
            <p>{twitterData.accountInformation.description}</p>
            <p>{twitterData.accountInformation.location}</p>
          </div>
        </Card>
        {twitterData?.metrics.map((card) => {
          return (
            <Card
              interactive={true}
              elevation={Elevation.TWO}
              style={{
                minWidth: "200px",
                minHeight: "200px",
              }}
              key={card.title}
            >
              <h5 style={{ fontSize: "large", color: "#394b59" }}>
                {card.title}
              </h5>
              <p style={{ fontSize: "xx-large" }}>{card.description}</p>
            </Card>
          );
        })}
      </div>
    </div>
  );
};

export default Twitter;
src/components/Twitter/index.js
export { default } from "./Twitter.js";
同样地,添加到 YouTube 组件中。
src/components/Youtube/Youtube.js
import React from "react";

import { Card, Elevation } from "@blueprintjs/core";
import Chart from "chart.js/auto";
import { Line, Bar } from "react-chartjs-2";
import {
  normaliseYoutubeMetrics,
  normaliseEstimatedMinutesWatched,
  normaliseEstimatedMinutesPerCountry,
} from "../../utils/normaliseData";

const Youtube = ({
  youtubeMetrics = {},
  youtubeMinutesDay = {},
  youtubeMinutesCountry = {},
}) => {
  const youtubeData = normaliseYoutubeMetrics(youtubeMetrics);
  const estimatedMinutesWatched =
    normaliseEstimatedMinutesWatched(youtubeMinutesDay);
  const estimatedMinutesWatchedCountry = normaliseEstimatedMinutesPerCountry(
    youtubeMinutesCountry
  );
  return (
    <div>
      <h5 style={{ fontSize: "large", textAlign: " left" }}>Youtube</h5>
      <div
        style={{
          display: "flex",
          flexWrap: "wrap",
          justifyContent: "space-between",
          gap: "10px",
        }}
      >
        {youtubeData?.map((card) => {
          return (
            <Card
              interactive={true}
              elevation={Elevation.TWO}
              style={{
                minWidth: "200px",
                minHeight: "200px",
              }}
              key={card.title}
            >
              <h5 style={{ fontSize: "large", color: "#394b59" }}>
                {card.title}
              </h5>
              <p style={{ fontSize: "xx-large" }}>{card.description}</p>
            </Card>
          );
        })}
        <Line
          data={estimatedMinutesWatched}
          style={{ maxHeight: "60%", maxWidth: "47%", marginTop: "10px" }}
        />
        <Bar
          data={estimatedMinutesWatchedCountry}
          style={{ maxHeight: "60%", maxWidth: "47%", marginTop: "10px" }}
        />
      </div>
    </div>
  );
};

export default Youtube;
src/components/Youtube/index.js
export { default } from "./Youtube.js";
让我们做一些修改App.js,并添加一些虚拟数据,让这一切运行起来!
src/App.js
...

import Twitter from "./components/Twitter";
import Youtube from "./components/Youtube";

import { dummyData } from "./dummyData";

...

const App = () => {
  const { metric = {} } = dummyData;

  return (
    <div className="App">
      ...
      {/* Middle Container to hold our Metrics */}
      <div
        style={{ marginLeft: "30px", marginTop: "80px", marginRight: "30px" }}
      >
        <div style={{ marginTop: "50px" }}>
          <Youtube
            youtubeMetrics={metric.youtubeMetrics}
            youtubeMinutesDay={metric.youtubeMinutesDay}
            youtubeMinutesCountry={metric.youtubeMinutesCountry}
          ></Youtube>
        </div>
        <Divider style={{ marginTop: "50px" }}></Divider>
        <div style={{ marginTop: "50px" }}>
          <Twitter twitter={metric.twitter.data}></Twitter>
        </div>
        <Divider style={{ marginTop: "50px" }}></Divider>
      </div>
      {/* Footer */}
      ...
   ...
...
它应该看起来像这样

步骤六:获取后端 API
让我们前往 Canonic 并克隆此 模板 以开始操作。它已经包含了 YouTube 和 Twitter 集成所需的所有设置。您可以选择:
- 使用此 示例项目 并继续,或者
-
克隆此项目,将 Twitter 和 Youtube 凭据替换为您自己的凭据,然后点击部署🚀。之后,它将使用您从服务中获取的数据。
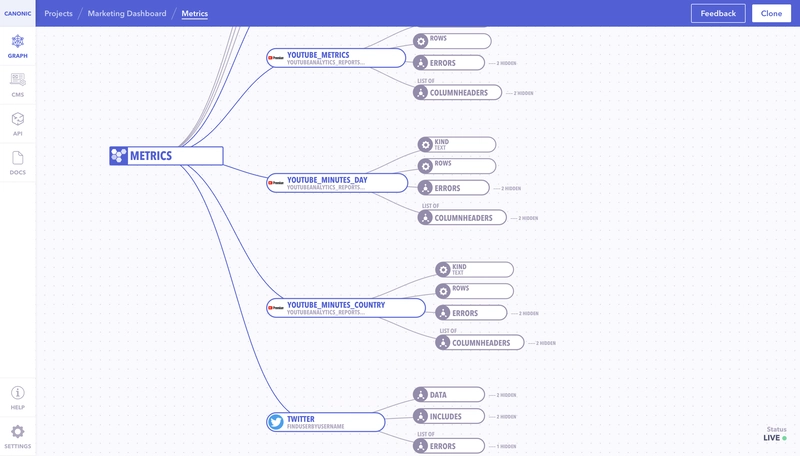

您可以 在 项目的文档部分查看GraphQL API 端点。
步骤 7:配置 GraphQL
我们使用ApolloClientGraphQL 连接到后端。请访问src/index.js:
- 导入新的依赖项
- 配置
ApolloClient - 用以下材料包裹我们的顶部组件
ApolloProvider
...
import { ApolloProvider, InMemoryCache, ApolloClient } from "@apollo/client";

/**
 * Connecting with the backend using apollo client
 */
const client = new ApolloClient({
  // Make sure you update the URI here to point to your backend
  uri: "https://marketing-dashboard.can.canonic.dev/graphql",
  cache: new InMemoryCache({
    addTypename: false,
  }),
});

ReactDOM.render(
  <React.StrictMode>
    <ApolloProvider client={client}>
      <App />
    </ApolloProvider>
  </React.StrictMode>,
  document.getElementById("root")
);
uri如果您克隆并部署了自己的项目,请将 ` <Endpoint>` 替换为您的 GraphQL API 端点。
步骤 8:配置 GraphQL 查询以获取数据
客户端和后端设置完成后,您可以随时前往“文档”选项卡获取更多 API 信息。该选项卡布局简洁,方便您浏览 API 文档。
创建一个 javascript 文件,src/gql/query.js并添加以下代码。
import { gql } from "@apollo/client";

/**
 * gql query to get customers information
 * The query parameters we got straight from Canonic autogenerated documentation
 */
export const GET_MARKETING_METRICS = gql`
  query {
    metric {
      youtubeMetrics {
        rows
        columnHeaders {
          columnType
          dataType
          name
        }
      }
      youtubeMinutesDay {
        rows
        columnHeaders {
          columnType
          dataType
          name
        }
      }
      youtubeMinutesCountry {
        rows
        columnHeaders {
          columnType
          dataType
          name
        }
      }
      twitter {
        data {
          name
          username
          profile_image_url
          location
          description
          public_metrics {
            followers_count
            following_count
            tweet_count
            listed_count
          }
        }
      }
    }
  }
`;
步骤 9:执行查询
让我们App.js最后再来一遍。我们将执行 API 并将数据传递给组件,以便它们能够显示实际数字。由于我们已经设置了与 API 响应类似的虚拟数据,这就像拨动开关一样简单,一切就完成了。
src/App.js
...
import { Navbar, Alignment, Divider, Spinner } from "@blueprintjs/core";

import { useQuery } from "@apollo/client";
import { GET_MARKETING_METRICS } from "./gql/query";

...

const App = () => {
  const { data = {}, loading } = useQuery(GET_MARKETING_METRICS);
  const { metric = {} } = data.metric ? data : dummyData;

  if (loading)
    return (
      <div style={{ margin: "200px" }}>
        <Spinner></Spinner>
      </div>
    );

  return (
    <div className="App">
      ...
    </div>
  );
};

export default App;
好了!整个集成就完成了。现在运行你的项目,yarn start它应该会显示成这样:

结论
希望本指南能帮助您更好地了解如何创建从 Twitter 和 YouTube获取数据的仪表盘,如何构建仪表盘结构,以及如何快速搭建并运行一个基本的仪表盘。您也可以点击 此处查看我们的其他指南。
欢迎加入我们的 Discord 服务器 ,与社区成员交流分享。如有任何技术支持需求,请发送邮件至 support@canonic.dev联系我们。访问我们的 网站 ,了解更多关于 Canonic 的信息。
文章来源:https://dev.to/canonic/how-to-build-a-twitter-youtube-analytics-dashboard-with-react-2p2d