面向软件工程师的 Jupyter Notebook 🚀
由 Mux 赞助的 DEV 全球展示挑战赛:展示你的项目!
Jupyter Notebook 是一个交互式 Web 应用程序,它与 iPython REPL 交互,允许您运行结构化但可迭代的 Python 脚本。它是数据科学家快速构建原型流程、可视化数据或执行临时分析的首选工具。
Jupyter Notebook 是可视化任何数据集以及进行即席分析的绝佳工具。它尤其适用于查询数据库并以可重复的方式显示数据。
设置您的环境
在开发任何 Python 项目时,我喜欢使用 Pyenv 和 Pyenv 虚拟环境封装器来管理所有不同的 Python 版本和依赖项。你可以在Pyenv 的 GitHub 代码库和虚拟环境封装器中找到安装指南。
如果您尚未安装 Python 3.6,请运行以下命令:
$ pyenv install 3.6.0
设置并激活新的虚拟环境:
# Create a Python 3.6.0 environment called jupyter-notebooks
$ pyenv virtualenv 3.6.0 jupyter-notebooks

# Start the virtual environment
$ pyenv activate jupyter-notebooks
接下来,安装所有需要的依赖项:
$ pip install jupyter pandas numpy matplotlib seaborn
最后,在你想要保存笔记本的目录中启动 Jupyter 服务器:
$ jupyter notebook
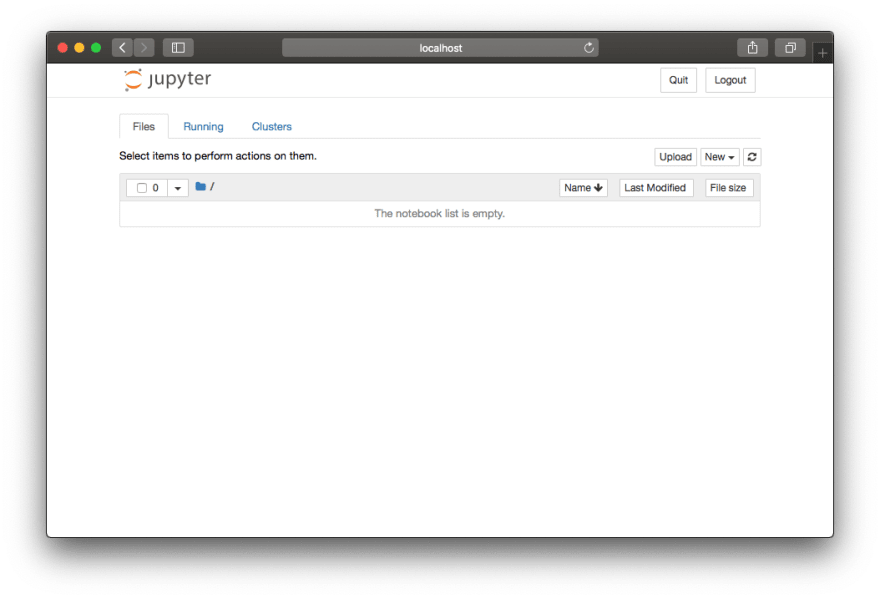
创建笔记本
使用页面右上角的下拉菜单创建笔记本。Jupyter 会自动打开并启动笔记本,方便您立即开始使用。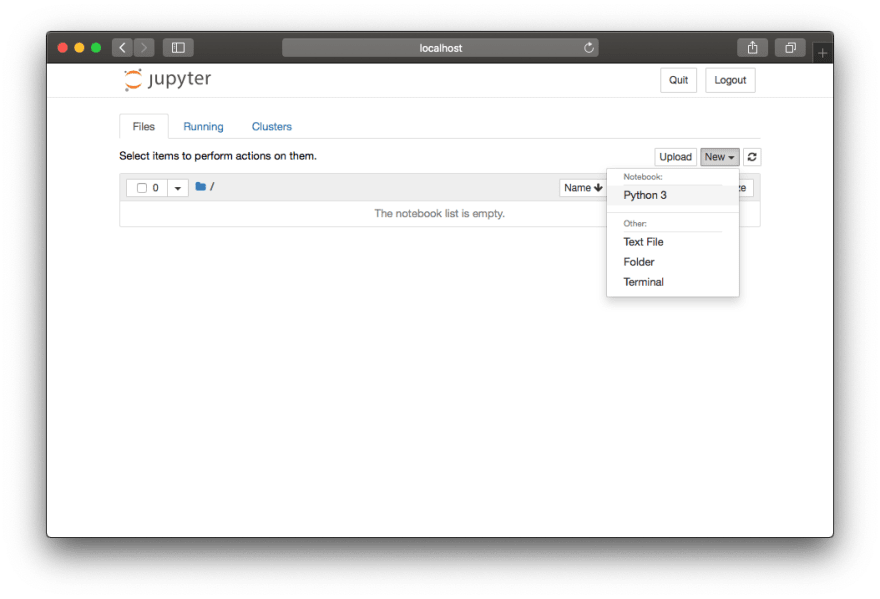

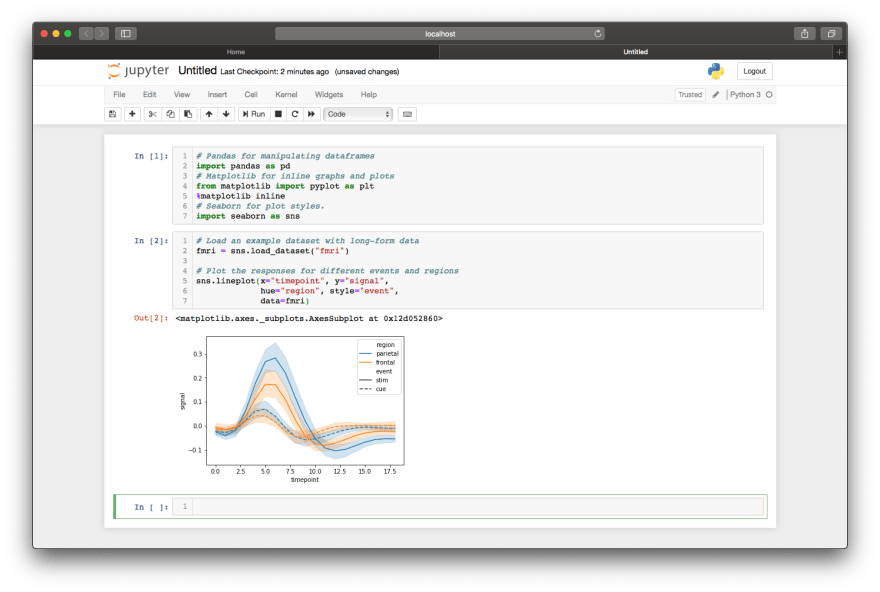
与其他 Python 文件一样,最佳实践是将导入语句放在文件顶部。在 Jupyter 中,我们可以使用第一个单元格来放置这些导入语句。编写完脚本后,按下 Shift + Enter 即可运行该单元格。
# Pandas for manipulating dataframes
import pandas as pd

# Matplotlib for inline graphs and plots
from matplotlib import pyplot as plt
%matplotlib inline

# Seaborn for plot styles.
import seaborn as sns
读取数据
CSV
Pandas 提供了一个方便的函数来读取 CSV 文件。下面是一些示例,但如果您需要更多信息,可以参考 Chris Albon 关于导入 CSV 文件的精彩博文。
# if the file has headers
df = pd.read_csv('path_to_file')

# if the file has no headers
df = pd.read_csv('path_to_file', headers=None)
探索数据
数据框加载完成后,有多种方法可以对其进行探索。要查看前n行,可以使用head默认返回前 5 行的函数,但也可以返回任意指定行数。
# Print the first 5
df.head()

# Print the first 10
df.head(10)
为了了解数据框中存储的数据的一些基本信息,该describe函数输出一个值摘要,其中排除了任何NaN值。
df.describe()
最后,为了完整地查看数据框,pandas 提供了一个option_context函数,可以在上下文中临时设置选项with。
# Set the max rows to print to 999 and print.
with pd.option_context('display.max_rows', 999):
    print (df)
修改和筛选数据
要访问数据框中的各个列和值,pandas 提供了loc参数。
# fetch a column
df['column_name']

# fetch a row
df.loc['index_value']

# fetch a single value
df.loc['index_value', 'column_name']

# filter a data-frame by a given condition
df.loc[lambda df: df['column_name'] > 3]
apply可以使用该函数轻松添加或修改列。
# create a new column based on other column values
df['new_column'] = df['old_column'].apply(lambda val: val * 2)

# override a column
df['old_column'] = df['old_column'].apply(lambda val: val * 2)
基本图形
在 Jupyter notebook 中绘制图形就像调用一个 seaboard 函数一样简单。
# create a line plot using your data frame
sns.lineplot(x="my_x_field", y="my_y_field", data=my_data_frame)
# create a scatter plot
sns.scatterplot(x="my_x_field", y="my_y_field", size="attribute_z",
                sizes=(10, 200), # size boundaries
                data=my_data_frame)
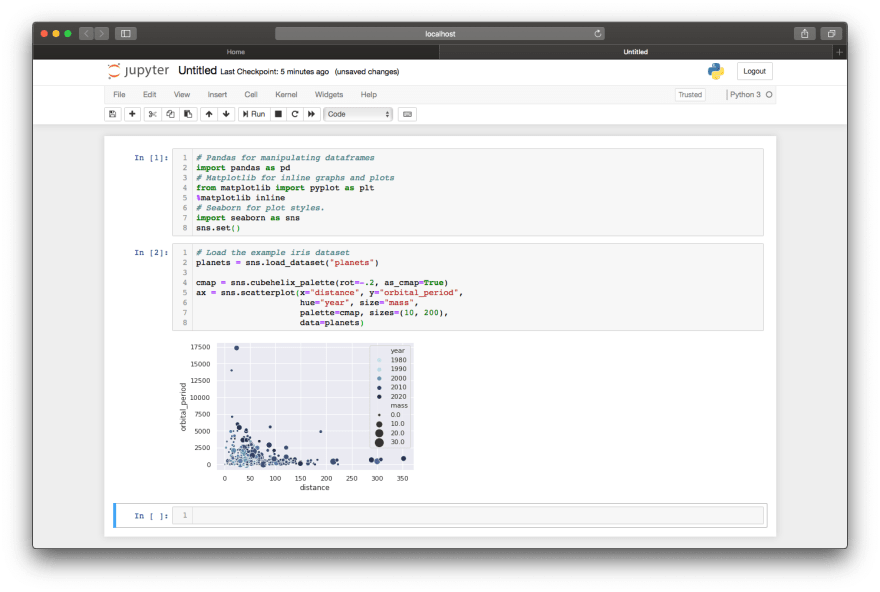
Seaborn网站提供了一系列示例,每个示例都附有用于生成它们的代码片段以及一些可供探索的示例数据集。
奖金
最近,GitHub 开始在其用户界面中渲染 Jupyter Notebook,使得运行和共享 Notebook 变得前所未有的轻松。iPython 代码库提供了一个很好的示例。